This extension allows you to debug the graphics API calls made by applications on the web, and store them. To activate the debugger you will have to either launch using the --enable-features=ray-gpu-inspector command line arg (or launch property for those on Windows), or navigate to chrome://flags and toggle on the setting for ray-gpu-inspector.
Note that the first approach is preferred as it auto-toggles off next launch, the second setting is more permanent and needs to be manually disabled. The extension takes a small amount of performance when running in the background, so forgetting to turn it off isn't the best situation.
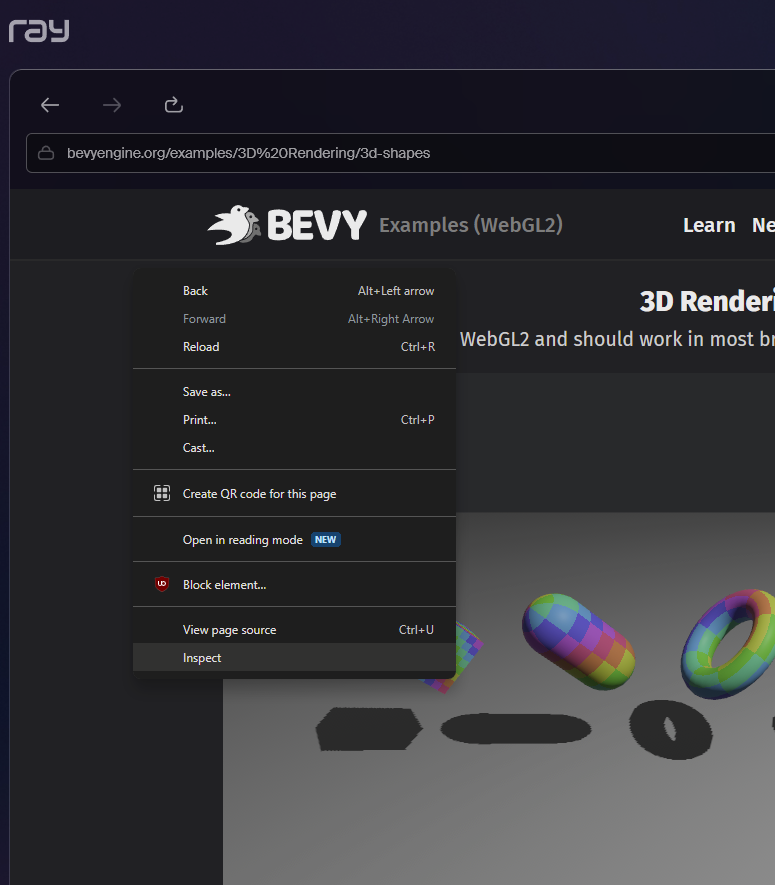
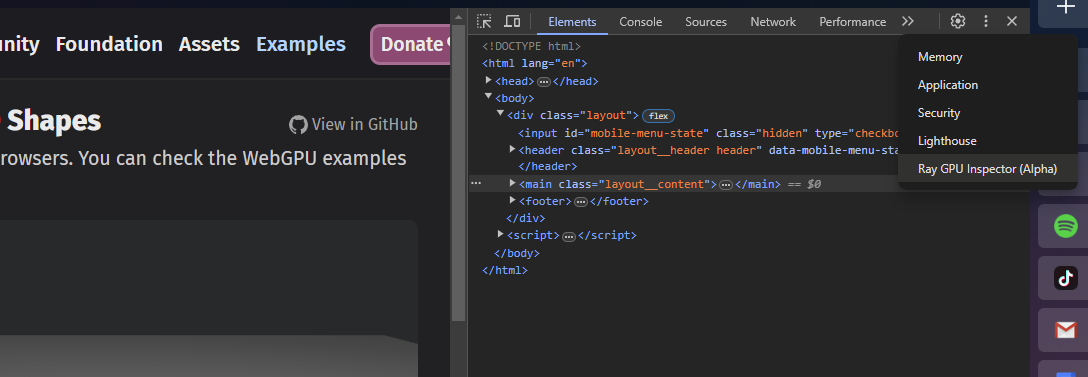
When you are done enabling the extension, you can view the new tab titled Ray GPU Inspector (Alpha) in the devtools panel. The easiest way of opening the devtools is opening the context menu (right mouse click) anywhere in the target site and clicking the inspect entry, at which point a new panel should pop up.
Showcases the context menu and the inspect entry
Showcases the debugger tab in the devtools
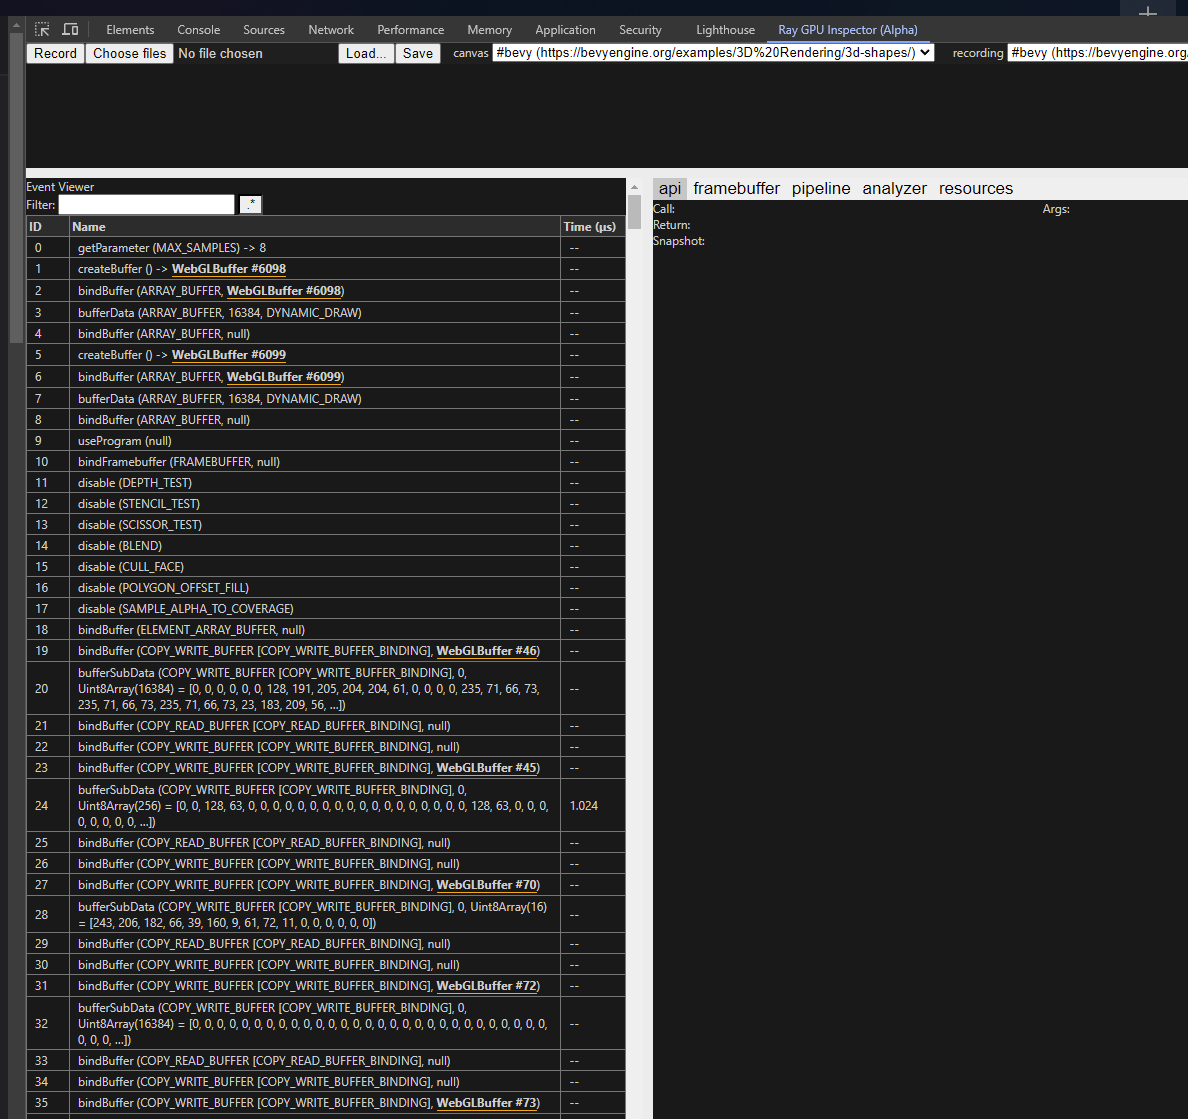
Once you navigate to the debuggers' tab you can now select the canvas the WebGL calls are being played in and press the record button.
The results after pressing record on a canvas that makes webgl calls